The Heads Up Indicator essentially allows you to track any Altcoin or Stock’s strength vs BTC or the larger Stock market base , you can add the Heads Up Indicator to a separate layout to evaluate different assets on your watch list, when you click on a different ticker-Altcoin/Stock it will automatically update on Heads Up allowing you to see how that coin/stock is performing vs BTC or the NASDAQ for example. You can also add it to your current layout below your RSI and OBV/VOL indicators and collapse or open it inside your existing setup using it only when you need to without taking up too much screen space.
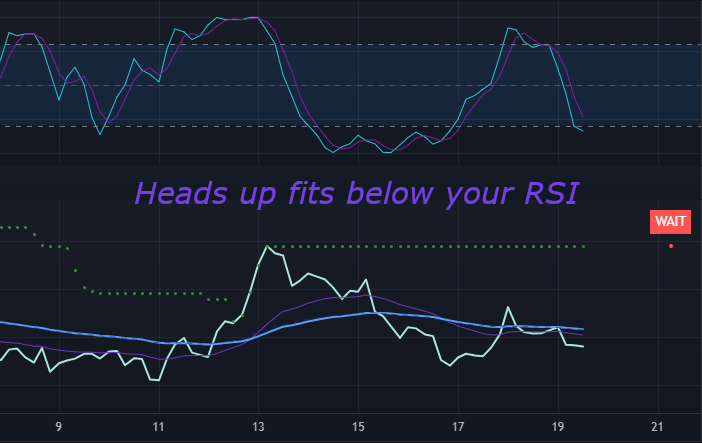
What you see inside Heads Up is essentially a chart of your Altcoin vs BTC – Stock vs Market base pair in the form of a Live Ratio line which updates in real time, you also then have an EMA 50 line and a fast EMA 20 line (which you can choose to disable in the settings if you prefer) the fast EMA 20 line just gives an added strength bonus if it has also moved above your EMA 50 and is currently sitting above it. The main focus is the Live Ratio and the EMA 50 these are the two main parts of the indicator, but Heads Up also uses a VWAP ( volume weighted average price ) indicator with anchor set to session from your USD chart so you will need a normal VWAP loaded on your price chart which Heads Up utilises in the background to evaluate your current trade setup or Altcoin/Stock condition.
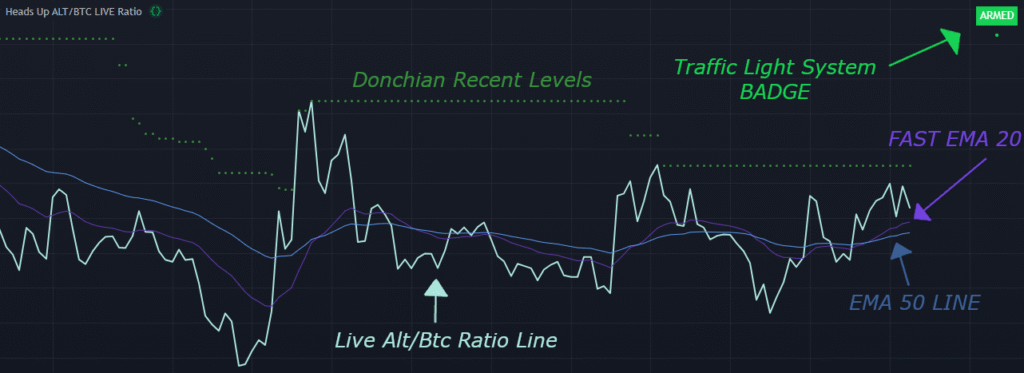
Heads Up also has a built in traffic light style system alerting you to when conditions have lined up. These conditions are 1 – that the price is sitting above the VWAP session line on your USD chart and 2 – that the live ratio Alt vs Btc – Stock vs Base line is above the EMA 50. When the indicator shows a red badge “WAIT” it means neither of these conditions for your Altcoin/Stock have been met. When the indicator shows an amber badge “WATCH” it means one of the two conditions have been met either the USD price is above the VWAP or the Live Ratio has gone above your EMA 50. When the indicator shows a green badge “ARMED” it means both of the conditions have lined up meaning your USD price is above your VWAP line and the Live Ratio line is above your EMA 50. When these two conditions are met and the badge is green “ARMED” it is then time to evaluate your trade and look for increasing volume and retests of the EMA 50 line or your VWAP line to determine whether a breakout or break of trend is confirmed.
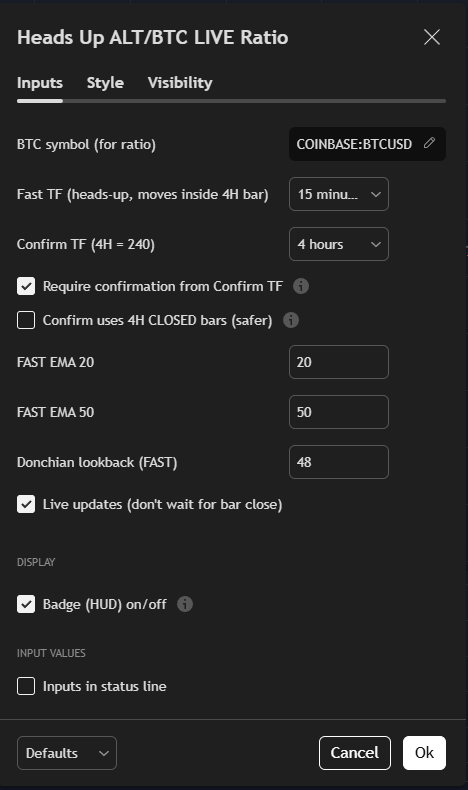
You can use the Heads Up indicator on different time frames but just like on any USD chart the 4hr can be more reliable than smaller TF’s, It really depends on your approach to the trade and what kind of chart you are looking at. The 4hr can be more useful for healthy swing trade conditions using it with other technical analysis to help you see when a break of trend or breakout could occur. On the smaller time frame 1hr for example the Live Ratio line will sometimes break through the EMA 50 before it does on the 4hr this is also the type of behaviour you would expect from a smaller TF on any chart, but it can be useful if you are tracking consolidating flat chart patterns and are trying to detect an early sign of strength before price breaks out. The lower you go on the TF the more prone to false signals it will be but again it will also depend on how you are approaching your trade and what kind of trader you are as even sometimes the 15m and 30m TF’s can offer earlier signs of strength when tracking consolidation patterns. You will need to also bare in mind that the 4hr is the confirmation you will need to see that it is indeed a breakout and not a fakeout. This is why the Heads Up indicator has been equipped with the 4h confirmation system which is a filter that runs in the background, you can turn this on in the settings.
A higher-timeframe filter that checks the 4-hour trend bias before surfacing lower-timeframe setups.
When it’s on, Heads-Up only highlights trades that agree with the 4H bias; when it’s off, you’ll see every raw setup.
Filters chop. The 4-hour trend changes less often than intraday candles, so it helps avoid counter-trend signals during noisy periods especially if you are viewing a smaller TF chart.
Focuses attention. You’ll spend time on pairs where the bigger picture already has momentum.
Keeps rules consistent. Same logic across any intraday chart you trade.
We derive a 4-hour trend baseline with an EMA by default EMA length 50, the length is configurable but 50 is the strongest bias which you will see for yourself once you load Heads Up on to any Altcoin/Stock chart.
We assess bias:
Bullish: 4H close above the baseline and the baseline is sloping up.
Bearish: 4H close below the baseline and the baseline is sloping down.
Neutral: mixed/flat conditions (no strong 4H signal).
With most market conditions using confirm TF 4h is usually the best option. You can also choose between using live 4h confirm data or closed candle confirm data, meaning the 4h confirmation will either be determined by the Live Ratio crossing above the EMA 50 in realtime or only once a 4h candle closes above which some users might prefer to provide better confirmation for coins with real long term trend and momentum.
The 4H confirmation filter doesn’t change your chart timeframe it just reads 4H data in the background.
Now onto the Donchian high levels you will see as green dots ( you can change the colour of any identifier in settings ) you can set these to different thresholds, when using a 4h confirmation regardless of the chart TF I prefer a 48 lookback period as it will highlight more recent high levels rather than only highlighting further back higher levels this is mainly because I don’t want to wait for a higher breakout confirmation especially in this current market i want to trade to the most recent high and then wait for confirmation of a further break of that level, so the most recent high level is a good marker for assessing breakouts or possible TP / resistance levels, remember these mark your Alt vs BTC – Stock vs Base ratio strength levels and not USD price levels but you will obviously see a correlation between the two also sometimes you might see that your Live Ratio high levels are higher or lower than the equivalent USD price levels on your USD chart above especially when you compare two close peaks on your chart.
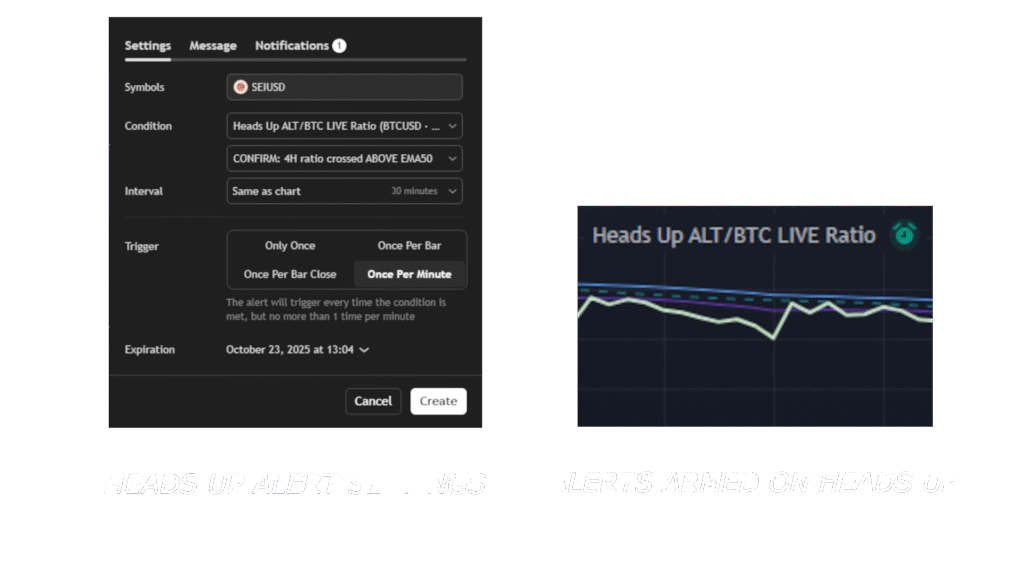
Heads Up allows you to set alerts via Trading View, you can set alerts for many different variables within the alerts settings panel by just right clicking on the indicator lines which will load the panel. In the image to the right as you can see once you set your alert it will show up on the heads up settings tab as a green clock icon. Nothing has been left out of this indicator it is fully equipped to keep you alert ready when it comes to reacting to the market. It has been updated to the latest version 3.0 for launch with every single feature fully tweaked and adjustable to your liking. The Heads Up indicator is one of a kind made by traders for traders in the Altcoin Crypto and Stock market space.
Hopefully this page has explained exactly how the Heads Up Indicator works and what it does, but we will delve further into details on the trading page to show how it can work in practice and other aspects of the indicators features.